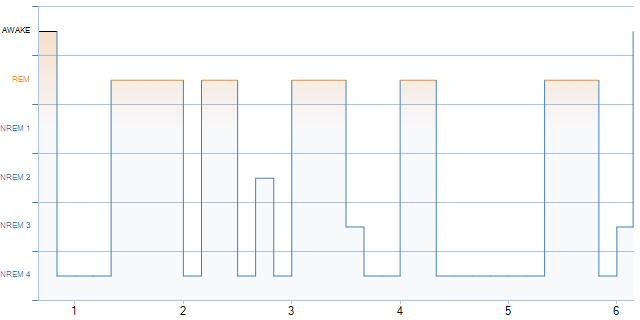
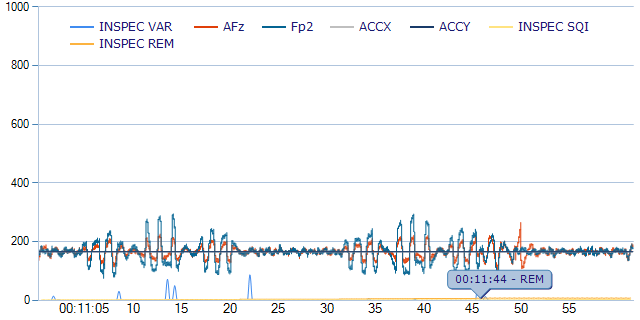
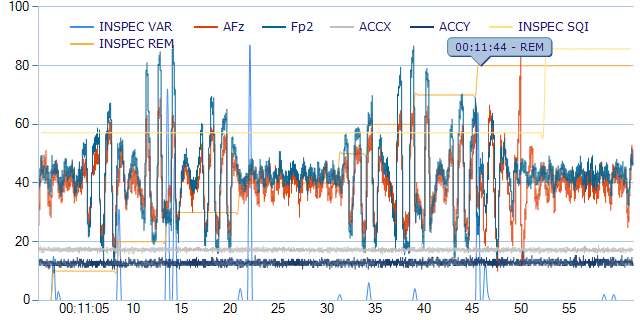
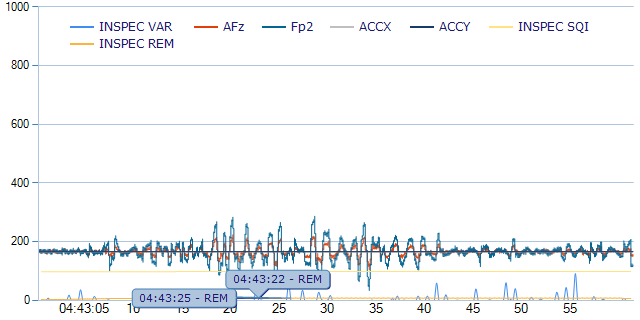
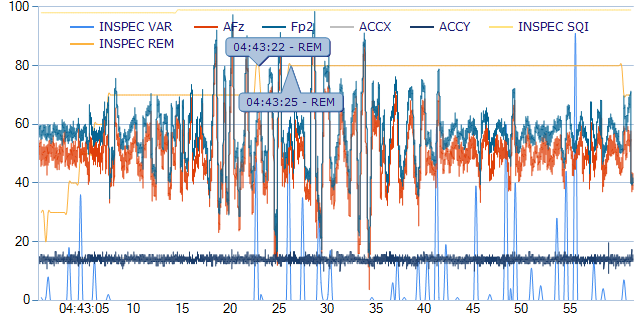
First known human EEG done while under the influence of Amanita Muscaria. I experienced a very drunk feeling and a heavy body feeling like I couldn’t get up as well as seeing shadows moving (that I believe should of been stationary shadows) all during this trip.
What we are testing:
EEGs are devices that collect brainwave data from the wearer. With the advent of consumer EEGs, data collection has become significantly more accessible. Amanita muscaria is an iconic mushroom that causes intoxication primarily through two molecules: ibotenic acid and muscimol. Muscimol, in particular, is considered the active compound.
Despite its history, studies and data regarding Amanita muscaria’s effect on brainwaves are sparse. This appears to be the first human EEG recorded during intoxication with Amanita muscaria. It remains unclear precisely how the mushroom induces hallucinations, as it does not act on classical psychedelic receptors.
Most intoxicants influence specific brainwave bands, and these effects vary across drug classes, including hypnotics, GABAergic agents, dissociatives, and classical psychedelics (Siegel, 2024). This analysis examines two administrations of an Amanita extract. Collecting this data provides a starting point for understanding when Amanita muscaria kicks in, peaks, and wears off, as well as how it affects specific brainwave bands and which cognitive effects are associated with those changes
Methods:
All EEG data were collected and processed using a 2014 Muse EEG headset. The app used to transmit the data to my computer was Muse Direct. Data was saved in the proprietary Muse format and compiled with Muse Player. PSPP was used to perform normality testing (Kolmogorov-Smirnov), independent-samples t-tests, and Mann-Whitney U tests. It was also utilized to generate histograms and bar graphs.
Custom scripts generated with assistance from Google Gemini were used to process the EEG recordings, perform spectral analysis, and create topographic visualizations. All outputs were manually reviewed before analysis. Because the Muse is limited to four channels, an additional topographic mapping technique was executed via a custom program. This program largely utilized the same code as Gemini, with the primary difference being the use of 5-minute epochs instead of 5-minute intervals with 4-second snapshots. Gemini was also used to clean the data and apply Welch’s method to perform a Fast Fourier Transform (FFT). Furthermore, Gemini calculated the spectral percentages, binned the data into 5-minute intervals, and computed the absolute power using a 10log10 formula (in decibels). These values serve as the primary data points in the graphs. Additionally, Gemini calculated Cohen’s d using the means and standard deviations from PSPP’s parametric models, as well as the rank-biserial correlation (r) via the Mann-Whitney test in PSPP. Power analyses were conducted using socscistatistics.com and homepage.univie.ac.at. Preliminary analysis and fact-checking were performed by Claude (Anthropic) and ChatGPT (OpenAI) to identify any discrepancies in the data.
Aggregation method (dB-relative). Relative band power values in the workbook were derived as follows: Gemini computed absolute power in decibels (10·log₁₀ of mean linear power) for each 5-minute bin; the per-bin dB values were then averaged across all bins; finally the averaged dB values were converted back to linear power (10^(dB/10)) and normalized to percentages to yield relative power. This approach is internally consistent with the analysis pipeline as built. However, it differs from the more commonly reported method, in which each epoch or bin is first converted to relative power and those percentages are then averaged. Because the dB-to-linear back-conversion is nonlinear (Jensen’s inequality: mean of logs ≠ log of means), the two approaches yield different relative percentages — the magnitude of the discrepancy varies by band and by night. Readers should be aware that the numeric relative-power values and significance tests reported in this study reflect the dB-averaging aggregation, not the per-epoch-relative-then-average approach.
The Amanita muscaria was sourced from amentera.com (formerly mnniceethnobotanicals) and Awakening Roots, both of which are verified sellers. The products purchased included raw mushroom caps, open caps, pieces, and a 5-gram chocolate bar from Amentera (5.61% Muscimo content 280.5mgs). The raw mushrooms were decarboxylated by boiling them for three hours with lemon juice, a process designed to rapidly convert ibotenic acid into muscimol as described in Shokuhin Eiseigaku Zasshi (1993). This yielded a 0.5 g/mL (about .015 -.05 mg of muscimol per mL) tincture. It was originally prepared for another project and had been stored in a freezer for approximately three months. The 5-gram chocolate bar arrived a week before the test.
The test consisted of eating the full chocolate bar and lying down in bed. Concerned about the potency of the chocolate due to potential incomplete decarboxylation, I consumed 2 mL of the tincture (totaling 1g) approximately 40 minutes into the session. The test officially started at 11:50 PM. Alarms were set to track the onset of effects from both the chocolate and the tincture, which helped align the data. The baseline (control) was recorded about three weeks after the original test, using the exact same protocol of lying down and sleeping.
Results:
Absolute band power (Treatment 1 vs Baseline 1)
The most noticeable thing when comparing baseline 1 and treatment 1 is that there is an immediate drop in all waves (with periodic spikes of sigma) throughout the experiment, while in baseline 1, there seem to be dips (likely correlated with transitions in sleep) and then spikes of many different waves, but delta (associated with sleep), specifically, while dominating in both, was trending lower in Treatment 1 and trending higher in baseline. This is very different from most GABAergic drugs studied, and even from dissociative studies with nitrous oxide (in some cases) Foster, B. L., & Liley, D. T. (2011). Yamamura, T., Fukuda, M., & Takeya, H., et al. (1981) show similar effects. Seemingly from my data and a chart I made (Treatment 1) seems to show a kick in around 45 minutes in. This also means I most likely did not catch the peak of the effects as it did not show a clear up trend or plateau in the treatment.
Even these studies, however, usually show some fluctuation or an increase in another wave (here, sigma did fluctuate but decreased overall); delta only decreases in REM sleep, and even then gamma fluctuates. Amanita produced a noticeably higher DTABR (sedation ratio) than the baseline condition, suggesting a stronger sedative effect.
View full article »